Los Gatos August 2026: One Sale at 156% of List Pulls $56M Month Into Focus
The month at a glance
| Metric | August 2026 |
|---|---|
| Closings | 23 |
| Median sale price | $1,850,000 |
| Median $/sq ft | $844 |
| Total volume | $56,468,456 |
| Price range | $507,506 – $6,800,000 |
| Median % of list | 97.6% |
| Sales over list | 7 of 23 (30%) |
| Sales under list | 14 of 23 (61%) |
Twenty-three closings is not a thin month for Los Gatos, but it is a quieter one than the summer run that preceded it—closings have dropped from 55 in June and 39 in July to 23 here. The overall median of $1,850,000 across all 23 sales tells a story that is partly compositional: nineteen of those sales were single-family homes, three were townhouses, and one was a condominium, and the condominium at $507,506 pulled the floor down while the upper-tier single-family sales did not fully compensate in median terms. The mean, at $2,455,150, sits $605,000 above the median—a gap that almost always signals a distribution skewed by a handful of high-end outliers, and this month had two of them above $5M.
Median price per square foot at $844 is the lowest recorded in the six-month window. That compression matters less than it appears at first: the median square footage of what closed this month was 2,329, concentrated in the lower and middle price bands, while the top two closings were priced at $2,200-plus per square foot and were large enough to move volume without moving the median much. Days on market was recorded for 14 of the 23 closings—just over half the month—so it is a directional signal, not a definitive read. Among those 14, the median was 27 days, with a range from 4 to 134 days, and five transactions carried a DOM over 60.
Every sale this month
| Address | Segment | Beds | Sq Ft | List Price | Sale Price | % of List |
|---|---|---|---|---|---|---|
| 130 Longmeadow Drive | Single Family | 5 | 3,892 | $6,995,000 | $6,800,000 | 97.2% |
| 14942 Larga Vista Drive | Single Family | 4 | 2,830 | $3,998,000 | $6,250,000 | 156.3% |
| 16970 Cypress Way | Single Family | 5 | 2,616 | $4,499,999 | $4,700,000 | 104.4% |
| 211 Glen Ridge Avenue | Single Family | 5 | 2,640 | $4,500,000 | $4,000,000 | 88.9% |
| 4 Tait Avenue | Single Family | — | 2,525 | $3,500,000 | $3,800,000 | 108.6% |
| 19601 Canon Drive | Single Family | 4 | 1,933 | $3,148,000 | $3,100,000 | 98.5% |
| 116 Meadowbrook Drive | Single Family | 3 | 1,861 | $2,450,000 | $2,825,000 | 115.3% |
| 42 Broadway | Single Family | 3 | 1,392 | $2,550,000 | $2,700,000 | 105.9% |
| 23444 Skyview Terrace | Single Family | 4 | 3,032 | $1,998,000 | $2,000,000 | 100.1% |
| 17250 Pine Avenue | Single Family | 4 | 2,066 | $1,999,999 | $2,000,000 | 100.0% |
| 25991 Mar Vista Court | Single Family | 3 | 3,284 | $2,098,000 | $2,000,000 | 95.3% |
| 630 Timberline | Single Family | 3 | 3,333 | $1,895,000 | $1,850,000 | 97.6% |
| 15795 Adams Ridge | Single Family | 3 | 2,760 | $1,849,000 | $1,800,000 | 97.3% |
| 405 Clearview Drive | Townhouse | 4 | 2,122 | $1,898,000 | $1,790,000 | 94.3% |
| 23056 Evergreen Lane | Single Family | 3 | 2,329 | $1,599,950 | $1,599,950 | 100.0% |
| 19850 Skyline Boulevard | Single Family | 3 | 3,385 | $1,599,888 | $1,500,000 | 93.8% |
| 18400 Overlook Road #13 | Townhouse | 2 | 1,507 | $1,380,000 | $1,370,000 | 99.3% |
| 152 Escobar Avenue | Townhouse | 2 | 1,015 | $1,359,000 | $1,359,000 | 100.0% |
| 16214 Redwood Lodge Road | Single Family | 3 | 2,096 | $1,299,000 | $1,250,000 | 96.2% |
| 20074 Beatty Ridge Road | Single Family | 3 | 2,450 | $1,495,000 | $1,225,000 | 81.9% |
| 351 Canyon Vista | Single Family | 2 | 1,365 | $1,150,000 | $1,085,000 | 94.3% |
| 15171 Old Ranch Road | Single Family | 2 | 1,684 | $999,000 | $957,000 | 95.8% |
| 576 W Parr Avenue #32 | Condominium | 2 | 1,054 | $550,000 | $507,506 | 92.3% |
Four transactions define August more than the other nineteen.
14942 Larga Vista Drive is the headline the rest of the month orbits. Listed at $3,998,000 for a 2017-built, 2,830-square-foot home on a 13.5-acre lot (589,802 sq ft), it closed at $6,250,000—156.3% of asking, a $2,252,000 premium. At $2,208 per square foot, it is the highest price-per-foot of the month. It sits on 13.5 acres and was newly built; no other August closing combined those two attributes. This sale alone moved the month's total volume by over $2M relative to what the list price implied.
130 Longmeadow Drive is the month's largest dollar closing at $6,800,000, and it is worth noting how orderly it was by comparison—97.2% of a $6,995,000 ask. A 1957-built, 5-bed home on 13,000 square feet, it closed at $1,747 per foot. No DOM recorded. Two luxury closings in a single month above $6M is notable on its own.
20074 Beatty Ridge Road is the sharpest discount in the month by absolute and percentage terms among sub-$2M homes. Listed at $1,495,000, it closed at $1,225,000—81.9% of ask. DOM was recorded at 48 days. Three thousand square feet of space at $500 per foot suggests this was a condition or location story the market priced accordingly.
116 Meadowbrook Drive is the cleanest example of the sub-$2.5M segment firing. A 3-bed, 1,861-square-foot home listed at $2,450,000 that closed at $2,825,000—115.3% over ask. The $1,518 per foot outcome puts it comfortably in luxury territory despite its list price, which means the strategy worked exactly as intended.
Where the market split
| Segment | Sales | Median Price | Median $/Sq Ft | Price Range |
|---|---|---|---|---|
| Single Family | 19 | $2,000,000 | $795 | $957,000 – $6,800,000 |
| Townhouse | 3 | $1,370,000 | $909 | $1,359,000 – $1,790,000 |
| Condominium | 1 | — | $482 | $507,506 (sole sale) |
Single family carried the month in every sense: 19 of 23 closings, the full spread from $957,000 to $6,800,000, and a segment median of $2,000,000 on 19 observations. The $795 median per foot in this segment looks modest until you remember that the three hillside properties under $700 per foot—Skyview Terrace, Mar Vista Court, and 630 Timberline—all delivered significant square footage at land-value-adjusted prices and pulled the segment's per-foot figure down. Strip those and the distribution tightens considerably toward the $1,500-plus range.
Townhouse produced three sales, just enough for a median with a caveat: on three observations, treat that $1,370,000 median as a range center, not a benchmark. The range of $1,359,000 to $1,790,000 is more instructive. All three sold under list; none attracted a premium. The highest per-foot reading in the segment, $1,339 at 152 Escobar Avenue, came from the smallest unit at 1,015 square feet. The condominium segment was a single sale—576 W Parr Avenue #32 at $507,506—and no median is computed from one data point. It sold at 92.3% of ask after an unknown number of days on market.
| Price Band | Sales | Median Price | Median $/Sq Ft |
|---|---|---|---|
| Under $1M | 2 | $732,253 | $525 |
| $1M – $1.5M | 5 | $1,250,000 | $795 |
| $1.5M – $2M | 5 | $1,790,000 | $652 |
| $2M – $3M | 5 | $2,000,000 | $968 |
| $3M – $5M | 4 | $3,900,000 | $1,559 |
| $5M and up | 2 | $6,525,000 | $1,978 |
The price-band table is where August becomes genuinely interesting. Per-foot prices do not climb linearly with band—they climb, compress, then climb again. The $1.5M–$2M band produces the lowest per-foot reading of any band above $1M at $652, which reflects the hillside and mountain properties (Mar Vista Court at $609, Skyline Boulevard at $443, Adams Ridge at $652) that deliver size but carry topographic discounts. The $2M–$3M band then jumps to $968 per foot, driven by tighter, flatter-lot inventory around the central town core. Above $3M, per-foot values accelerate sharply—$1,559 at the $3M–$5M band and $1,978 at the top—which is consistent with demand compression at the luxury end where substitutes are scarce.
The under-$1M band at two sales produces a median of $732,253. With only two observations, the range ($507,506 to $957,000) is what matters, and the spread within it is wide. Both sold under list.
Against asking
| Category | Count | Share |
|---|---|---|
| Over list | 7 | 30% |
| At list | 2 | 9% |
| Under list | 14 | 61% |
| Biggest premium | 14942 Larga Vista Drive | +56.3% |
| Biggest discount | 20074 Beatty Ridge Road | –18.1% |
| Median % of list | 97.6% | — |
Sixty-one percent of August closings came in under list price. That is not a collapse—the median of 97.6% shows most sellers absorbed modest haircuts, not meaningful ones—but it is a market where the default outcome is a negotiation rather than a premium. The seven over-list sales were concentrated in properties priced below $2.8M at time of listing: 14942 Larga Vista (listed $3,998,000 but the outcome was exceptional), 116 Meadowbrook Drive, 42 Broadway, 4 Tait Avenue, 16970 Cypress Way, and 23056 Evergreen Lane. The pattern holds: well-priced entry points in good locations still draw competition. Properties that sat and came in under—Beatty Ridge at –18.1%, Skyline Boulevard at –6.2%, Glen Ridge at –11.1%—show what happens when pricing overshoots by enough that buyers feel no urgency.
The 56.3-point spread between the biggest premium and the biggest discount is the widest possible reading of market discipline this month. It is not that the market is confused; it is that two very different products—a rare land-heavy compound and a property with apparent condition or location friction—attracted very different responses. The median tells the true center: a 2.4% discount from list is where most of August settled.
Six months in context
| Month | Closings | Median Price | Median $/Sq Ft |
|---|---|---|---|
| March 2026 | 20 | $2,457,500 | $1,371 |
| April 2026 | 48 | $2,153,500 | $1,183 |
| May 2026 | 56 | $2,610,500 | $1,238 |
| June 2026 | 55 | $2,800,000 | $1,147 |
| July 2026 | 39 | $2,580,000 | $1,094 |
| August 2026 | 23 | $1,850,000 | $844 |
The trend line is direct: closings peaked in May and June, have declined every month since, and August's 23 is the lowest in the six-month window. The median price at $1,850,000 is the lowest in the window as well. Median per-foot at $844 is down from $1,371 in March—a 38% decline across six months.
Year-over-year comparison is not available. The data source carries no confirmed closings for August 2025, and no comparison is drawn.
A compositional caveat is warranted before reading too much into the trend. March had 20 closings that skewed toward larger, more expensive single-family homes and produced a high median per foot; the summer months had 48 to 56 closings that included a wider spectrum of product. August's 23 closings include a disproportionate share of hillside and mountain-road inventory—segments that characteristically carry lower per-foot values—alongside the two $6M-plus closings that boosted volume without moving the median much. The per-foot compression from June to August may reflect mix as much as softening. That said, active inventory at 160 properties with 25 pending and a median active list price of $1,699,000 signals that supply has not tightened. Buyers have options.
What it means
For sellers: The data does not support aggressive overpricing right now. Fourteen of 23 August closings came in under list, and the properties that sold over asking were almost uniformly priced below $2.6M at list. Above that level, the market in August demonstrated patience—sometimes rewarding sellers who priced correctly (16970 Cypress Way at 104.4%), sometimes grinding down sellers who did not (211 Glen Ridge at 88.9% after apparent negotiation). If your property is genuinely differentiated—rare lot, new construction, central location—the premium is still out there, as 14942 Larga Vista proved emphatically. If it is not, price where the market is, not where you want it to be. Active inventory at 160 properties means buyers have alternatives and know it.
For buyers: August offered a wider negotiating window than spring did. The majority of closings required sellers to accept something less than ask, and the five DOM-over-60 properties (out of 14 with recorded DOM) suggest that patience has a payoff at certain price points. The $1.5M–$2M band is where the most product is changing hands, and it is also where per-foot values look most compressed—partly because hillside properties carry inherent trade-offs in access and utility costs that do not show up in the square-footage number. Run those numbers before the comparable. The 25 pending sales indicate the market is still moving; this is not a moment of distress, just a moment of reasonable balance.
For owners not transacting: Nothing in August signals a market in trouble. Volume was $56.5M on 23 closings, two sales closed above $6M, and the median held at $1,850,000 despite a compositional mix that included hillside discounts and a single sub-$510,000 condo. The longer six-month arc—declining closings and a softening median per foot—is worth watching but is not yet a signal to act on. The spring surge through June set a high bar, and some seasonal deceleration into August is ordinary. Check back when the fall data lands.
Tim McMullen · Tim McMullen, Broker · CA DRE #02016832
[email protected] · (415) 691-9272
More from Los Gatos
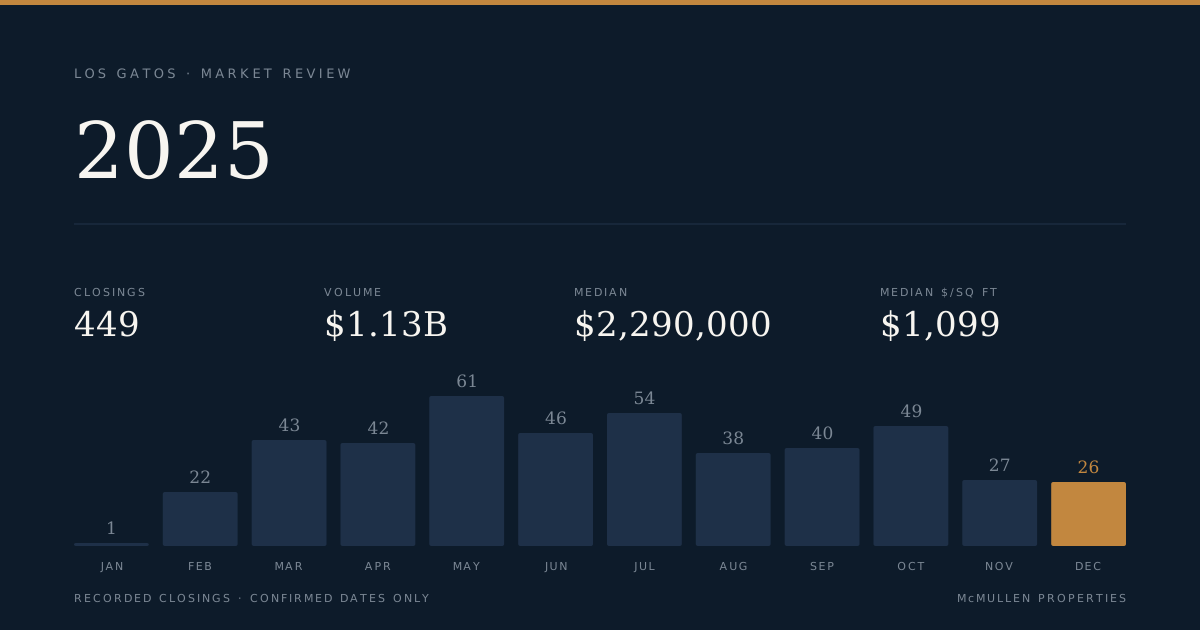
449 Closings, $1.13 Billion: Los Gatos 2025 by the Numbers
The full-year record covers 449 closed transactions across single-family, townhouse, and condominium segments, with a market-wide median of $2,290,000 and total volume of $1,129,374,552. The sharpest divide of the year ran not between segments but between price bands: the $2M–$3M band logged 101 closings while the top tier above $5M managed just 25, yet that upper tier posted the highest median price-per-square-foot of any band at $1,484.
343 acres sold in Los Gatos for $13 million — at $37,880 per acre
The sale of 25373 Spanish Ranch Road recorded as a land transaction, not a house sale. At 343.19 acres and $13 million, price per acre is the only unit that makes sense.
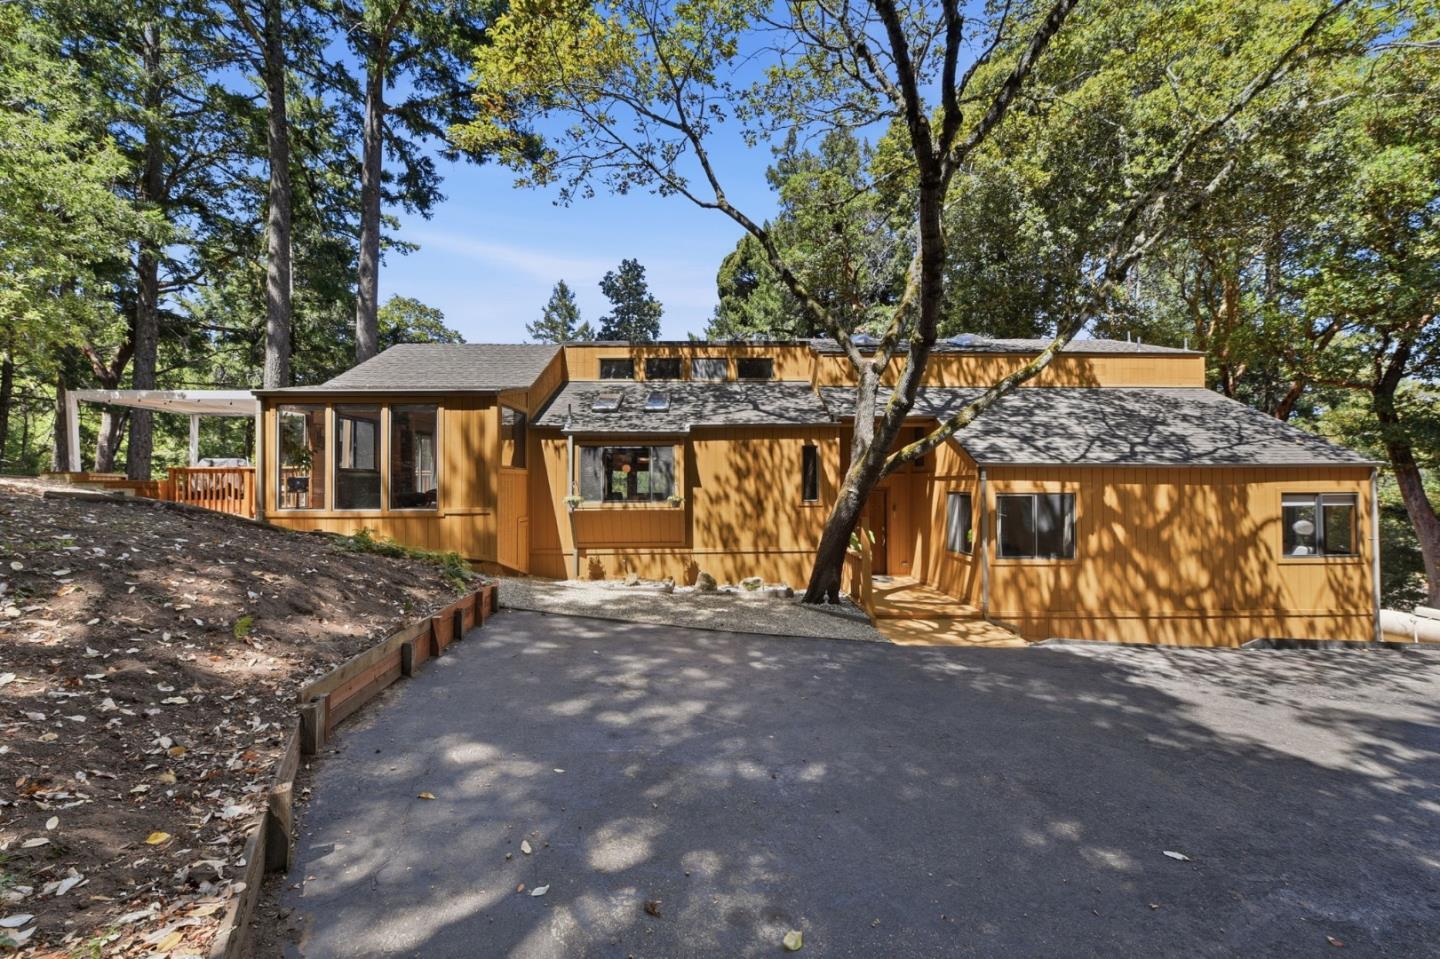
Back on the market 7 months after it last sold, at $98,000 more
22163 Miller Ridge Road recorded as sold in February 2026 for $1,400,000. It hit the active market again in August at $1,498,000 — a $98,000 spread in under seven months.