449 Closings, $1.13 Billion: Los Gatos 2025 by the Numbers
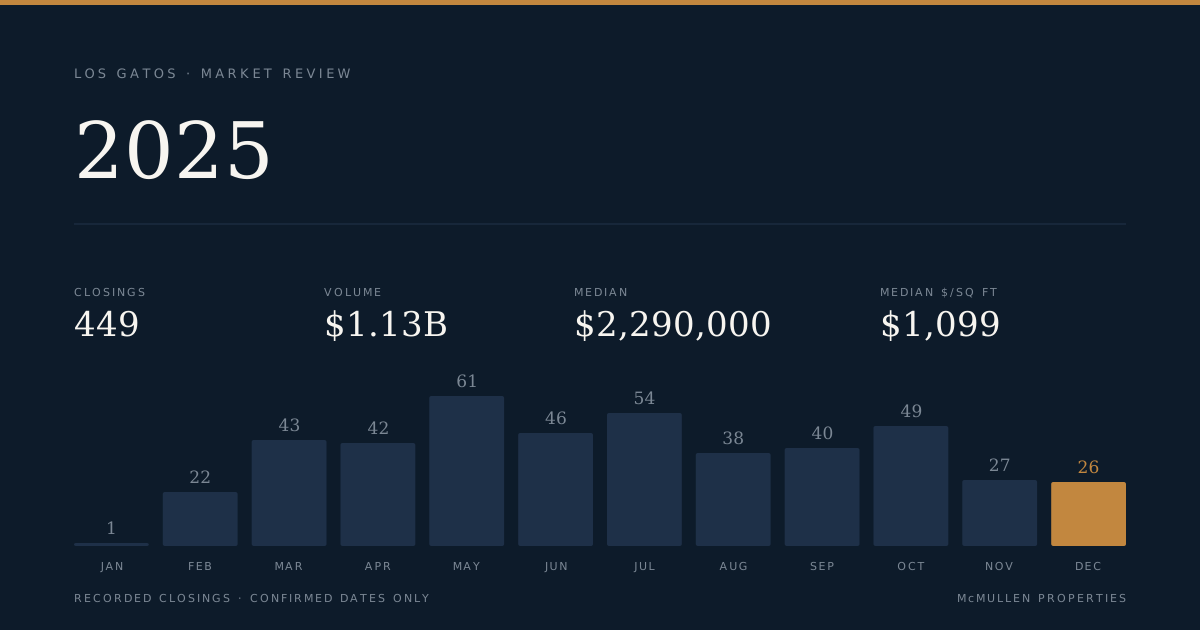
The period at a glance
| Metric | Value |
|---|---|
| Period | January 1 – December 31, 2025 |
| Total closings | 449 |
| Total volume | $1,129,374,552 |
| Median sale price (all segments) | $2,290,000 |
| Median price per sq ft (all segments) | $1,099 |
| Median square footage | 2,047 |
| Median lot size | 9,672 sq ft |
| Price range | $341,250 – $8,200,000 |
| Median days on market | 20 (reported on all 449 closings) |
| Longest recorded DOM | 574 |
| Closings under 7 days | 102 (22.7%) |
| Closings over 60 days | 88 (19.6%) |
List prices were not available in the source data for this period.
The headline figure is a market split that runs in opposite directions depending on which measure you use. By closing count, the $2M–$3M band was the busiest single tier of the year with 101 transactions — more than the combined total of the two lowest bands put together on a per-band basis. Yet the 25 closings above $5M recorded the year's highest median price per square foot at $1,484, beating even the $3M–$5M band ($1,346/sq ft, 126 closings) that was the largest band by volume. The practical implication: larger homes in the upper tier closed at a per-foot premium, not a discount, relative to the broader market's $1,099 median.
Days on market tell a story of a polarized year. With DOM recorded on all 449 closings, the figures are complete. The median was 20 days, but 102 sales (22.7%) closed in under a week and 88 (19.6%) took more than two months. That spread — nearly a quarter of the market moving in six days or less, another fifth taking over sixty — describes a year where similar-looking properties produced very different outcomes depending on factors the record does not always show. The single longest hold was 574 days.
The sales
The table below shows the top 40 closings by price out of 449 total. It is not a complete roster.
| Address | Closed | Price | Sq Ft | $/Sq Ft | Beds | DOM | Year Built |
|---|---|---|---|---|---|---|---|
| 156 Highland Avenue | Mar 6 | $8,200,000 | 5,824 | $1,408 | 5 | 9 | 1999 |
| 140 Twin Oaks Drive | Jun 26 | $8,000,000 | 4,661 | $1,716 | 4 | 54 | 1968 |
| 17050 Wild Way | Oct 18 | $8,000,000 | 4,253 | $1,881 | 5 | 0 | 1929 |
| 17148 Mill Rise Way | Jun 13 | $7,700,000 | 6,400 | $1,203 | 6 | 62 | 2005 |
| 107 Kennedy Court | Jun 23 | $7,600,000 | 4,877 | $1,558 | 6 | 0 | 1996 |
| 16541 Cypress Way | Oct 31 | $7,450,000 | 7,292 | $1,022 | 5 | 141 | 1988 |
| 15651 Kennedy Road | Dec 20 | $6,940,000 | 4,226 | $1,642 | 4 | 81 | 1952 |
| 106 Longmeadow Drive | Oct 14 | $6,500,000 | 4,379 | $1,484 | 5 | 16 | 1978 |
| 160 Prospect Avenue | Jul 30 | $6,429,450 | 3,937 | $1,633 | 5 | 40 | 2018 |
| 286 Mountain Laurel Lane | Oct 1 | $6,250,000 | 4,612 | $1,355 | 6 | 6 | 2008 |
| 114 Nina Court | Jun 9 | $6,250,000 | 3,006 | $2,079 | 4 | 13 | 1955 |
| 16420 S Kennedy Road | Oct 10 | $6,200,000 | 6,087 | $1,019 | 7 | 7 | 1920 |
| 141 Alta Tierra Court | Mar 19 | $6,000,000 | 6,676 | $899 | 5 | 49 | 1983 |
| 16665 Magneson Loop | May 16 | $5,950,000 | 4,002 | $1,487 | 5 | 14 | 2025 |
| 16207 Short Road | Apr 28 | $5,900,000 | 4,532 | $1,302 | 5 | 18 | 1920 |
| 16428 Peacock Lane | Jun 2 | $5,850,000 | 6,272 | $933 | 5 | 7 | 2003 |
| 15581 Glen Una Drive | Oct 16 | $5,500,000 | 3,807 | $1,445 | 4 | 80 | 1937 |
| 111 Reservoir Road | Feb 14 | $5,200,000 | 3,396 | $1,531 | 4 | 13 | 1952 |
| 115 Yosemite Way | Sep 19 | $5,100,000 | 3,250 | $1,569 | 5 | 8 | 2017 |
| 57 Ellenwood Avenue | Nov 19 | $5,050,000 | 3,355 | $1,505 | 4 | 153 | 1920 |
| 15110 Shannon Road | Jul 23 | $5,000,000 | 6,280 | $796 | 6 | 111 | 1982 |
| 75 Alpine Avenue | Oct 14 | $5,000,000 | 3,354 | $1,491 | 5 | 8 | 1900 |
| 105 Highland Avenue | Jul 22 | $5,000,000 | 4,081 | $1,225 | 5 | 149 | 2003 |
| 526 San Benito Avenue | Apr 29 | $5,000,000 | 3,967 | $1,260 | 5 | 28 | 2007 |
| 222 Bella Vista Avenue | Sep 11 | $5,000,000 | 3,116 | $1,605 | 4 | 36 | 2016 |
| 17655 Tourney Road | Apr 28 | $4,800,000 | 5,217 | $920 | 5 | 42 | 1980 |
| 14594 Eastview Drive | May 15 | $4,768,000 | 3,589 | $1,329 | 5 | 20 | 1967 |
| 15902 Rochin Terrace | Jun 26 | $4,700,000 | 3,576 | $1,314 | 4 | 6 | 1952 |
| 14860 Las Flores Lane | Sep 2 | $4,700,000 | 4,192 | $1,121 | 4 | 8 | 1975 |
| 112 Johnson Hollow | Jun 16 | $4,675,000 | 3,030 | $1,543 | 4 | 3 | 1988 |
| 14205 Shannon Road | May 20 | $4,630,000 | 4,588 | $1,009 | 5 | 24 | 2001 |
| 131 Pinta Court | Feb 21 | $4,625,000 | 4,199 | $1,101 | 4 | 6 | 1965 |
| 16070 Shannon Road | Apr 15 | $4,600,000 | 3,647 | $1,261 | 5 | 14 | 1996 |
| 193 La Montagne Court | Jun 4 | $4,550,000 | 3,960 | $1,149 | 5 | 57 | 1999 |
| 17095 Summit Way | Jul 18 | $4,550,000 | 3,500 | $1,300 | 4 | 7 | 1966 |
| 16244 Kennedy Road | Dec 31 | $4,500,000 | 3,645 | $1,235 | 5 | 42 | 1970 |
| 105 Via Santa Maria | Apr 23 | $4,500,000 | 2,900 | $1,552 | 4 | 22 | 2019 |
| 15797 Orange Blossom Lane | Apr 8 | $4,500,000 | 3,007 | $1,497 | 5 | 3 | 1955 |
| 16100 Jasmine Way | Nov 21 | $4,405,000 | 3,195 | $1,379 | 6 | 8 | 2005 |
| 104 Albert Court | Apr 8 | $4,370,000 | 2,259 | $1,934 | 4 | 8 | 1966 |
Four transactions from the top of the roster are worth reading closely, because together they demonstrate how inconsistently size and speed predict price in this segment.
156 Highland Avenue closed for $8,200,000 on March 6 — the year's highest sale — at 5,824 square feet on 131,551 square feet of land, working out to $1,408 per square foot. It was on the market nine days. It is the only sale above $8M.
114 Nina Court closed at $6,250,000 in June at just 3,006 square feet, producing the highest price per square foot in the entire top-40 roster at $2,079. The 1955-built home sits on 41,382 square feet of land and was in contract within 13 days. It shows that the per-foot ceiling is not reserved for the largest or newest homes.
16541 Cypress Way closed at $7,450,000 — third-highest price of the year — yet recorded 141 days on market across 7,292 square feet (the largest footprint in the top 40), delivering the lowest per-foot figure of any home priced above $7M at $1,022. The extended timeline and lower per-foot rate in this large-lot, large-footprint home stands against the simpler assumption that price and pace move together.
17050 Wild Way closed at $8,000,000 with zero days recorded on market — meaning it entered the MLS and went under contract on the same date. Built in 1929 and measuring 4,253 square feet, it cleared at $1,881 per square foot, the second-highest per-foot figure in the top 40 and the highest among homes above $7M. The same day-zero pattern appeared at 107 Kennedy Court ($7,600,000).
Where the market split
By segment
| Segment | Closings | Median Price | Median $/Sq Ft | Median Sq Ft | Price Range |
|---|---|---|---|---|---|
| Single Family | 337 | $2,798,000 | $1,235 | 2,306 | $341,250 – $8,200,000 |
| Townhouse | 74 | $1,534,000 | $967 | 1,582 | $817,450 – $2,350,000 |
| Condominium | 38 | $827,500 | $724 | 1,128 | $380,000 – $2,650,000 |
The single-family segment accounted for 337 of 449 closings — 75 percent of the market by transaction count. Its median of $2,798,000 ran $1,264,000 above the townhouse median, itself $706,500 above the condominium median. The per-foot gradient follows the same staircase: single-family at $1,235, townhouse at $967, condominium at $724. That is a 70.6 percent gap between the top and bottom segments on a per-foot basis across the full year's record.
The condominium segment's upper end is worth noting: one condominium closed at $2,650,000, meaning the segment's ceiling crossed the single-family segment's median. The 38-closing condominium sample is the smallest of the three; its median is drawn from that full count, with a range of $380,000 to $2,650,000 reflecting genuine dispersion in that segment.
By price band
| Band | Closings | Median $/Sq Ft |
|---|---|---|
| Under $1M | 50 | $703 |
| $1M – $1.5M | 68 | $770 |
| $1.5M – $2M | 79 | $974 |
| $2M – $3M | 101 | $1,262 |
| $3M – $5M | 126 | $1,346 |
| $5M and up | 25 | $1,484 |
The $3M–$5M band was the busiest of the year with 126 closings — more transactions than any other single band — yet its median per-foot rate of $1,346 was beaten by the much smaller $5M-and-up tier at $1,484. Between the bottom band (Under $1M, $703/sq ft) and the top (above $5M, $1,484/sq ft) there is an $781/sq ft spread, and the curve is not smooth: the largest single step occurs between the $1.5M–$2M band ($974) and the $2M–$3M band ($1,262), a jump of $288 per square foot across a $1M price increment. That inflection point at $2M appears to represent where the per-foot rate meaningfully reprices rather than creeping upward gradually.
The sub-$1M band's 50 closings confirm that entry-level product exists in Los Gatos — largely in the condominium and townhouse segments — at a per-foot rate roughly half the single-family median.
Across the period
| Month | Closings | Median Price | Median $/Sq Ft |
|---|---|---|---|
| Jan 2025 | 1 | $1,475,000 | $970 |
| Feb 2025 | 22 | $1,731,500 | $1,100 |
| Mar 2025 | 43 | $2,350,000 | $1,080 |
| Apr 2025 | 42 | $2,240,000 | $1,208 |
| May 2025 | 61 | $2,400,000 | $1,138 |
| Jun 2025 | 46 | $2,610,000 | $1,131 |
| Jul 2025 | 54 | $1,914,500 | $956 |
| Aug 2025 | 38 | $2,155,000 | $1,153 |
| Sep 2025 | 40 | $2,465,000 | $1,232 |
| Oct 2025 | 49 | $2,775,000 | $1,080 |
| Nov 2025 | 27 | $2,220,000 | $962 |
| Dec 2025 | 26 | $1,901,000 | $959 |
January's single closing produces no useful median and is noted here only for completeness; no pattern should be read into its figures.
The month-by-month data describes three distinct phases. The first, February through June, shows the market finding its stride: volume climbed from 22 closings in February to 61 in May, the busiest month of the year, and the median price reached its single-month peak in June at $2,610,000. Per-foot rates during this stretch ranged from $1,080 to $1,208, showing relative consistency even as volume fluctuated.
July marks a clean break. Volume rose to 54 closings — the second-busiest month — but the median price dropped to $1,914,500, the lowest of any month with meaningful volume, and the per-foot median fell to $956, below the year's $1,099 average. This divergence between high volume and lower medians in July suggests the mix of what closed shifted toward smaller and lower-priced product that month, though the record alone does not explain why the mix changed.
The autumn phase, August through October, saw per-foot and price medians recover. October's median price of $2,775,000 was the highest of any month and nearly matched June's per-foot rate at $1,080. November and December then returned to lower medians as volume contracted — December's 26 closings and $1,901,000 median closed the year roughly where February opened it, though at higher absolute figures than the winter entry point.
What it means
For sellers
The year produced 449 closings and $1.13 billion in total volume, with the heaviest closing activity concentrated between March and July. Single-family properties accounted for 337 of those closings at a median of $2,798,000. DOM was recorded on every closing: the median was 20 days, but 88 properties (19.6 percent) took more than 60 days to close, and the longest recorded hold was 574 days. The top-40 roster shows that properties carrying higher per-foot rates did not uniformly clear faster — 57 Ellenwood Avenue (153 DOM) and 16541 Cypress Way (141 DOM) both closed above $5M. The connection between asking-period length and final price is not linear in this record.
For buyers
The $2M–$3M band held 101 closings, the largest single-band count, at a median of $1,262 per square foot. The $3M–$5M band immediately above it held 126 closings at $1,346 — a $84/sq ft step for a meaningful price increase. The 22.7 percent of closings that cleared in under seven days establish that some properties moved to contract before buyers with longer timelines could complete due diligence; the same record shows another 19.6 percent spent over two months without closing, which describes a different pool of properties entirely. Both populations were active throughout the year.
For owners not transacting
The full-year median of $2,290,000 across 449 closings, combined with a $1,099 per-square-foot median, represents the broadest single-year sample the Los Gatos record provides. Volume was distributed across all twelve months, with no extended period of zero activity. The condominium segment's ceiling at $2,650,000 and the single-family segment's floor at $341,250 confirm that the market accommodated a wide span of product types at closing. The year's aggregate record is now fixed; 2026's record begins from here.
Tim McMullen · Tim McMullen, Broker · CA DRE #02016832
[email protected] · (415) 691-9272
More from Los Gatos
343 acres sold in Los Gatos for $13 million — at $37,880 per acre
The sale of 25373 Spanish Ranch Road recorded as a land transaction, not a house sale. At 343.19 acres and $13 million, price per acre is the only unit that makes sense.
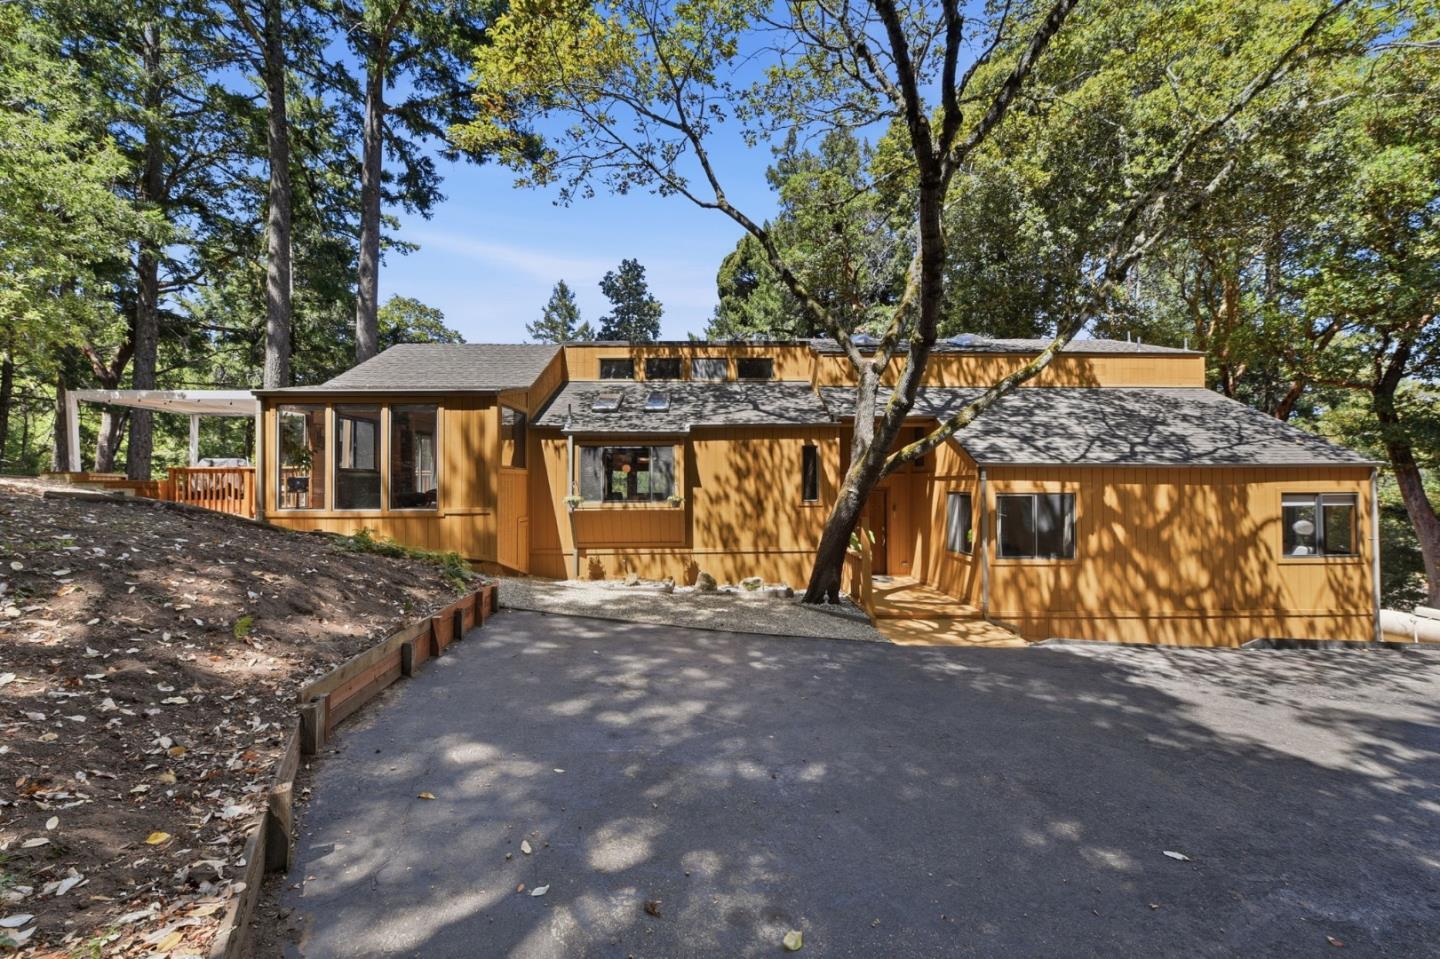
Back on the market 7 months after it last sold, at $98,000 more
22163 Miller Ridge Road recorded as sold in February 2026 for $1,400,000. It hit the active market again in August at $1,498,000 — a $98,000 spread in under seven months.
Los Gatos August 2026: One Sale at 156% of List Pulls $56M Month Into Focus
Twenty-three closings across all segments produced $56.5M in volume, with a single hillside single-family sale at 14942 Larga Vista Drive accounting for more than 11% of it—and closing at $2.25M over asking.