June 2026 in Los Gatos: More homes sold under asking than over, yet the median still climbed
# June 2026 in Los Gatos: More homes sold under asking than over, yet the median still climbed
Fifty-five closings. Thirty-one sold below list price, twenty sold above it. That split — under-list outselling over-list by more than fifty percent — didn't stop the overall median from landing at $2,800,000, with single-family homes carrying most of the weight. June wasn't a month where buyers routinely paid more than sellers asked. It was a month where the market mostly met sellers partway, or a little less.
Every recorded sale this month
All 55 closings, in order of price. Each address links to its full record.
| Address | Type | Bd/Ba | Sq ft | List | Sold | % of list | DOM | Closed |
|---|---|---|---|---|---|---|---|---|
| 140 Twin Oaks Drive | Single Family | 5/4.5 | 4,661 | $8,300,000 | $7,800,000 | 94.0% | 32 | Jun 26 |
| 16255 Short Road | Single Family | 4/4 | 4,179 | $5,995,000 | $5,700,000 | 95.1% | 10 | Jun 1 |
| 104 Alerche Drive | Single Family | 5/5 | 5,187 | $5,400,000 | $5,450,000 | 100.9% | 0 | Jun 25 |
| 101 Glen Ridge Avenue | Single Family | 6/5.5 | 5,521 | $5,600,000 | $5,400,000 | 96.4% | 128 | Jun 11 |
| 16383 Aztec Ridge Drive | Single Family | 6/7 | 6,001 | $5,988,000 | $5,250,000 | 87.7% | 260 | Jun 29 |
| 130 Sierra Azule | Single Family | 4/3.5 | 4,788 | $5,499,000 | $5,200,000 | 94.6% | 39 | Jun 4 |
| 108 Harwood Court | Single Family | 5/3.5 | 4,471 | $4,998,000 | $5,030,000 | 100.6% | 8 | Jun 8 |
| 16988 Kennedy Road | Single Family | 4/4.5 | 3,466 | $4,398,000 | $4,200,000 | 95.5% | 11 | Jun 12 |
| 116 Regent Drive | Single Family | 4/3.5 | 3,320 | $3,798,000 | $4,000,499 | 105.3% | 11 | Jun 8 |
| 16251 Maya Way | Single Family | 4/2.5 | 4,228 | $3,995,000 | $3,750,000 | 93.9% | 100 | Jun 17 |
| 365 Pennsylvania Avenue | Single Family | 4/3.5 | 3,653 | $3,488,000 | $3,650,000 | 104.6% | 23 | Jun 5 |
| 120 Hilow Court | Single Family | 4/2.5 | 2,240 | $3,598,000 | $3,600,000 | 100.1% | 7 | Jun 10 |
| 141 Serra Court | Single Family | 5/3 | 2,403 | $3,398,000 | $3,500,000 | 103.0% | 7 | Jun 1 |
| 16150 Jasmine Way | Single Family | 4/2 | 2,136 | $3,500,000 | $3,500,000 | 100.0% | 0 | Jun 16 |
| 70 Central Avenue | Single Family | 4/2.5 | 2,488 | $3,499,000 | $3,439,900 | 98.3% | 60 | Jun 18 |
| 186 Lu Ray Drive | Single Family | 4/3 | 2,564 | $3,498,000 | $3,430,000 | 98.1% | 19 | Jun 18 |
| 17391 E Vineland Avenue | Single Family | 4/3.5 | 2,221 | $2,998,000 | $3,300,000 | 110.1% | 7 | Jun 24 |
| 115 Belhaven Drive | Single Family | 6/3 | 2,448 | $2,998,000 | $3,300,000 | 110.1% | 6 | Jun 23 |
| 244 Belblossom Drive | Single Family | 4/3 | 2,311 | $3,250,000 | $3,300,000 | 101.5% | 24 | Jun 8 |
| 15741 Orange Blossom Lane | Single Family | 4/3 | 2,414 | $3,498,000 | $3,200,000 | 91.5% | 18 | Jun 10 |
| 237 Harding Avenue | Single Family | 3/2 | 2,326 | $3,298,000 | $3,175,000 | 96.3% | 17 | Jun 8 |
| 16514 Marchmont Drive | Single Family | 2/1 | 928 | $3,000,000 | $3,128,000 | 104.3% | 0 | Jun 30 |
| 216 Montclair Road | Single Family | 3/2.5 | 2,309 | $2,895,000 | $3,050,000 | 105.4% | 26 | Jun 3 |
| 15827 Linda Avenue | Single Family | 4/3.5 | 2,782 | $2,998,000 | $3,000,000 | 100.1% | 28 | Jun 5 |
| 14900 Quito Road | Single Family | 4/2.5 | 2,672 | $2,988,000 | $2,920,000 | 97.7% | 50 | Jun 24 |
| 25 Grove Street | Single Family | 4/3.5 | 2,216 | $3,200,000 | $2,900,000 | 90.6% | 189 | Jun 24 |
| 87 College Avenue | Single Family | 4/3.5 | 2,868 | $2,950,000 | $2,895,750 | 98.2% | 9 | Jun 23 |
| 113 Mojonera Court | Single Family | 4/2 | 1,935 | $2,798,000 | $2,800,000 | 100.1% | 8 | Jun 3 |
| 3 Euclid Avenue | Single Family | 4/2 | 1,904 | $2,798,000 | $2,700,000 | 96.5% | 8 | Jun 22 |
| 103 Belwood Gateway | Single Family | 4/3 | 1,730 | $2,598,000 | $2,598,000 | 100.0% | 9 | Jun 5 |
| 227 Howes Drive | Single Family | 4/2 | 1,918 | $2,450,000 | $2,570,000 | 104.9% | 10 | Jun 29 |
| 121 Edelen Avenue | Single Family | 2/2.5 | 2,065 | $2,500,000 | $2,500,000 | 100.0% | 10 | Jun 12 |
| 16857 Farley Road | Single Family | 3/2 | 1,605 | $2,299,000 | $2,415,000 | 105.0% | 18 | Jun 26 |
| 20471 Black Road | Single Family | 4/3 | 2,573 | $2,750,000 | $2,400,000 | 87.3% | 79 | Jun 30 |
| 54 Whitney Avenue | Single Family | 3/2 | 1,204 | $2,298,000 | $2,350,000 | 102.3% | 8 | Jun 17 |
| 14355 La Rinconada Drive | Single Family | 4/3 | 2,044 | $2,488,000 | $2,340,000 | 94.1% | 54 | Jun 2 |
| 16737 Leroy Avenue | Single Family | 4/3 | 1,525 | $2,399,888 | $2,300,000 | 95.8% | 56 | Jun 16 |
| 15206 Watkins Drive | Townhouse | 3/2.5 | 1,999 | $2,300,000 | $2,220,000 | 96.5% | 49 | Jun 15 |
| 175 La Canada Court | Single Family | 3/2 | 1,155 | $2,248,000 | $2,200,000 | 97.9% | 32 | Jun 9 |
| 219 Beethoven Lane | Single Family | 4/2.5 | 2,100 | $2,198,000 | $2,100,000 | 95.5% | 86 | Jun 11 |
| 8 Central Court | Single Family | 2/2 | 1,380 | $1,799,888 | $1,640,500 | 91.1% | 95 | Jun 17 |
| 24035 Stage Stop Way | Single Family | 3/2.5 | 2,889 | $1,499,000 | $1,500,000 | 100.1% | 52 | Jun 23 |
| 107 Charter Oaks Circle | Townhouse | 3/2 | 1,295 | $1,550,000 | $1,485,000 | 95.8% | 7 | Jun 24 |
| 230 Escobar Avenue | Condominium | 2/2 | 1,494 | $1,388,000 | $1,435,000 | 103.4% | 4 | Jun 4 |
| 139 El Olivar | Townhouse | 3/2.5 | 1,637 | $1,500,000 | $1,400,000 | 93.3% | 22 | Jun 15 |
| 23059 Evergreen Lane | Single Family | 3/2.5 | 1,962 | $1,279,000 | $1,279,000 | 100.0% | 31 | Jun 30 |
| 23762 Hutchinson Rd | Single Family | 3/3 | 2,522 | $1,274,786 | $1,250,088 | 98.1% | 20 | Jun 22 |
| 18081 Redwood Drive | Single Family | 3/2 | 1,402 | $1,248,888 | $1,241,730 | 99.4% | 69 | Jun 18 |
| 21550 Locust Drive | Single Family | 3/2 | 1,294 | $1,175,000 | $1,160,000 | 98.7% | 5 | Jun 9 |
| 16279 Gellatt Court | Condominium | 1/1 | 1,039 | $1,159,000 | $1,090,000 | 94.0% | 72 | Jun 29 |
| 25967 Mar Vista Court | Single Family | 3/2 | 1,571 | $999,888 | $1,025,000 | 102.5% | 54 | Jun 17 |
| 21496 Mary Alice Way | Single Family | 2/2 | 1,240 | $1,024,000 | $975,000 | 95.2% | 92 | Jun 29 |
| 20246 Gist Road | Single Family | 4/2 | 2,262 | $1,049,000 | $939,000 | 89.5% | 150 | Jun 30 |
| 439 Alberto Way #A102 | Condominium | 3/2 | 1,452 | $879,000 | $880,000 | 100.1% | 13 | Jun 18 |
| 576 W Parr Avenue #9 | Condominium | 2/1 | 934 | $573,000 | $550,000 | 96.0% | 74 | Jun 18 |
The numbers
| Metric | June 2026 |
|---|---|
| Total closings | 55 |
| Median sale price | $2,800,000 |
| Median price per sq ft | $1,147 |
| Median days on market | 22 |
| Sale-to-list ratio (median) | 98.2% |
| Sold above list | 20 |
| Sold below list | 31 |
What sold
Single-family homes dominated the month in the way they always do here, accounting for 48 of 55 closings — 87% of volume. The range was wide: $939,000 on the low end to $7,800,000 at the top. The median came in at $2,960,000, with a median of $1,211 per square foot and a median 22 days on market.
Condominiums saw four sales, ranging from $550,000 to $1,435,000. Four transactions isn't enough to publish a meaningful median, so the range is what the data supports.
Townhouses had three sales, from $1,400,000 to $2,220,000. Same situation — three sales, no median.
What moved the median
The mix didn't do it. Single-family homes made up 87% of June closings versus 82% in May — a five-point shift, but not large enough to explain the movement in the overall median on its own. The median sale price of $2,800,000 reflects what the single-family segment, in particular, actually closed at this month. That's the straightforward read.
The one to notice
20471 Black Road listed at $2,750,000 and closed at $2,400,000 — $350,000 below asking, a 12.7% reduction, the deepest cut of the month. That's not a rounding error. It took 55 closings across June to produce one gap that wide on the downside, and this was it.
For contrast: 17391 E Vineland Avenue listed at $2,998,000 and closed at $3,300,000 — $302,000 over asking, 10.1% above list, the widest overbid of the month. Two homes priced within $250,000 of each other, one closing more than $350,000 below list and the other more than $300,000 above it. That range — nearly $900,000 between those two outcomes from comparable list prices — is the clearest illustration of how differently individual properties landed in June, even within the same price band.
The top sale was 140 Twin Oaks Drive, which closed at $7,800,000 after 32 days on market. At 4,661 square feet, that's a price per square foot well above the segment median. It sat on the market longer than most — the median single-family home found a buyer in 22 days — but it closed, and it closed at the month's highest recorded price.
Coverage period: March 10 – August 13, 2026, based on recorded MLS closings for June 2026. All figures are medians unless otherwise noted.
Source: MLSListings closed sales in Los Gatos, June 2026. 55 closings. Sale prices and closing dates are matters of public record. A summary of recorded sales is not an appraisal and is not an opinion of value on any specific home.
Tim McMullen · DRE #02016832 · How these numbers are put together
More from Los Gatos
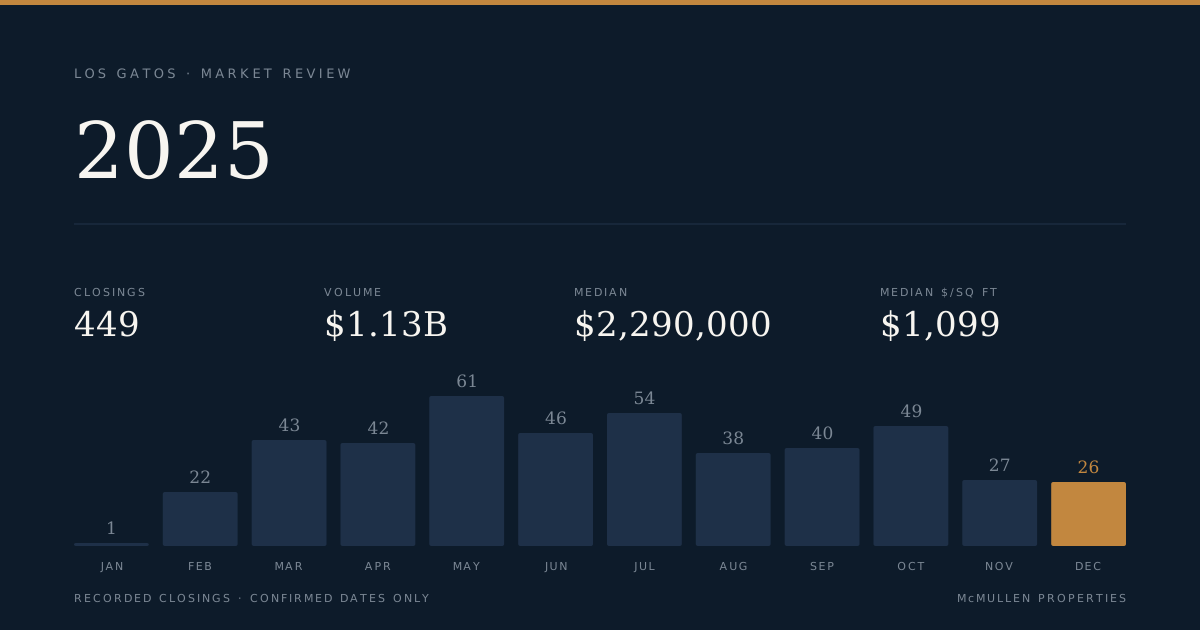
449 Closings, $1.13 Billion: Los Gatos 2025 by the Numbers
The full-year record covers 449 closed transactions across single-family, townhouse, and condominium segments, with a market-wide median of $2,290,000 and total volume of $1,129,374,552. The sharpest divide of the year ran not between segments but between price bands: the $2M–$3M band logged 101 closings while the top tier above $5M managed just 25, yet that upper tier posted the highest median price-per-square-foot of any band at $1,484.
343 acres sold in Los Gatos for $13 million — at $37,880 per acre
The sale of 25373 Spanish Ranch Road recorded as a land transaction, not a house sale. At 343.19 acres and $13 million, price per acre is the only unit that makes sense.
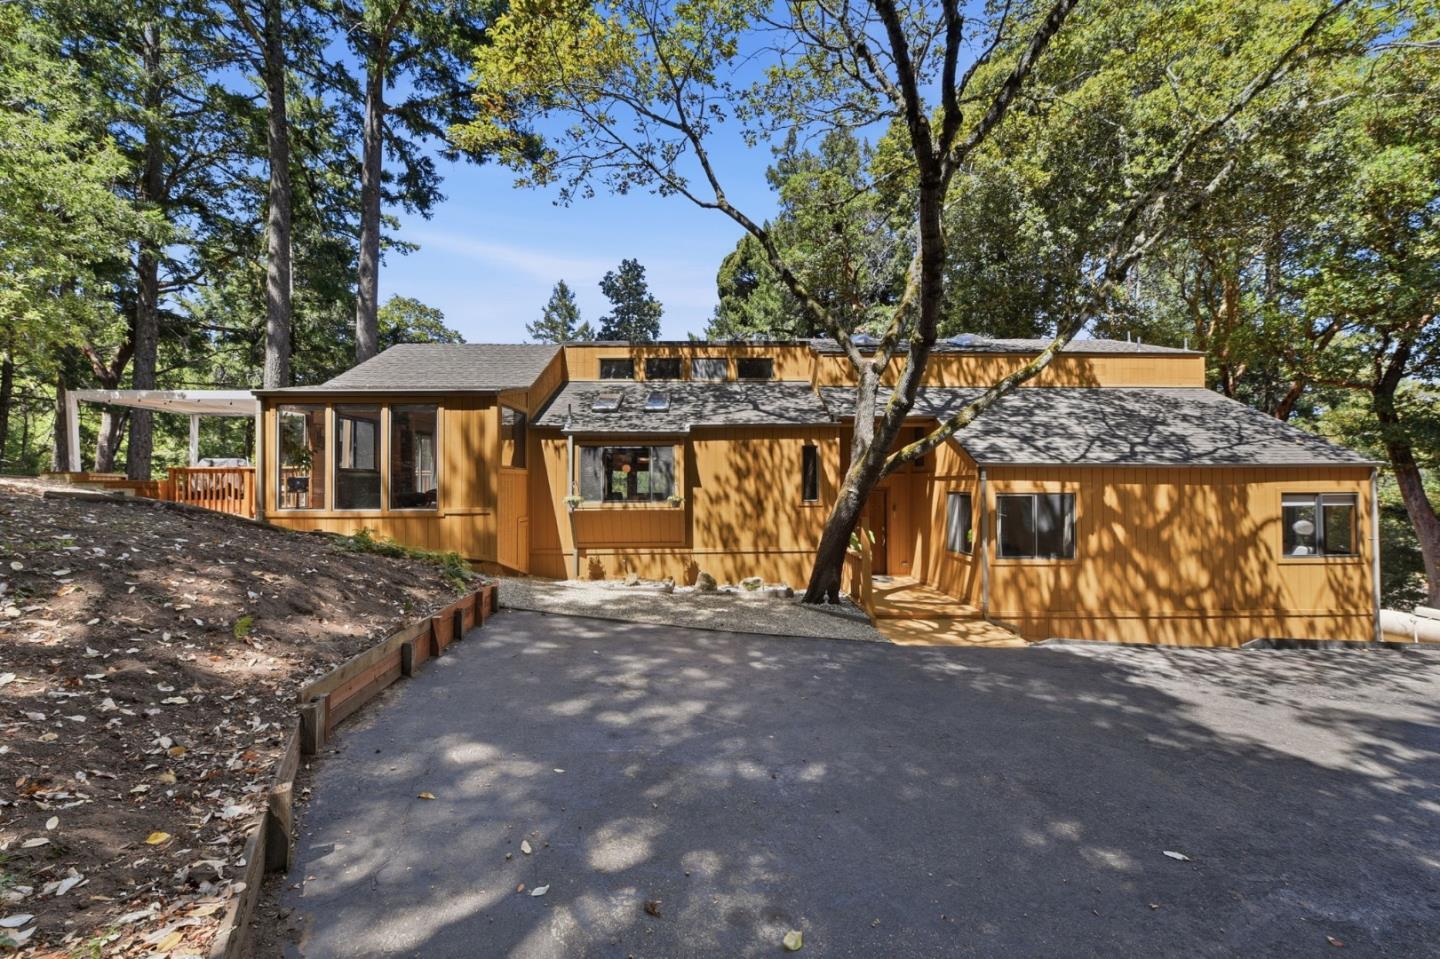
Back on the market 7 months after it last sold, at $98,000 more
22163 Miller Ridge Road recorded as sold in February 2026 for $1,400,000. It hit the active market again in August at $1,498,000 — a $98,000 spread in under seven months.